This code loads network data, preprocesses it, reduces dimensions with an autoencoder, and trains multiple classifiers (KNN, RF, LR, SVM) for anomaly detection.
Sure, here’s a sample README file for the provided Python code:
Network Anomaly Detection
This project implements a machine learning pipeline to detect network anomalies using various classification algorithms. The dataset used for this project contains network traffic data with labeled anomalies.
requirements.txt: List of Python packages required for the project.
anomaly_detection.ipynb: Jupyter notebook containing the code.
Data
The dataset used for this project contains network traffic data with labeled anomalies. It is loaded from a CSV file located in the dataset/network_anomaly_detection/ directory.
Exploratory Data Analysis
Initial data exploration includes:
Viewing the first and last few rows of the dataset.
Checking data types and missing values.
Plotting the distribution of the target variable.
Visualizing feature correlations.
Data Preprocessing
Steps include:
Handling missing values and duplicates.
Encoding categorical variables.
Scaling numerical features using MinMaxScaler.
Dimensionality Reduction
An autoencoder is used for dimensionality reduction to select the most important features.
Model Training and Evaluation
Four different classifiers are trained and evaluated:
K-Nearest Neighbors (KNN)
Random Forest
Logistic Regression
Support Vector Machine (SVM)
The performance of each model is assessed using a classification report.
Results
The results of the models, including precision, recall, and F1-score, are printed for each classifier.
Contributing
Contributions are welcome! Please fork the repository and submit a pull request.
License
This project is licensed under the MIT License. See the LICENSE file for details.
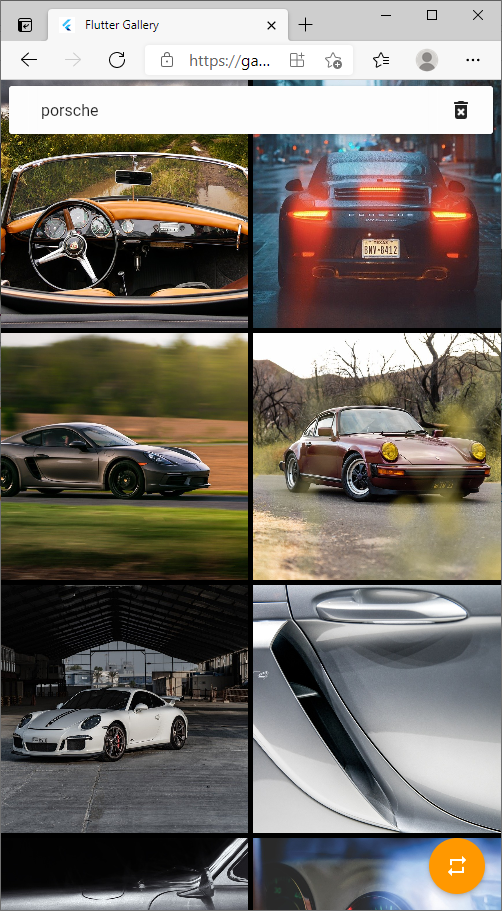
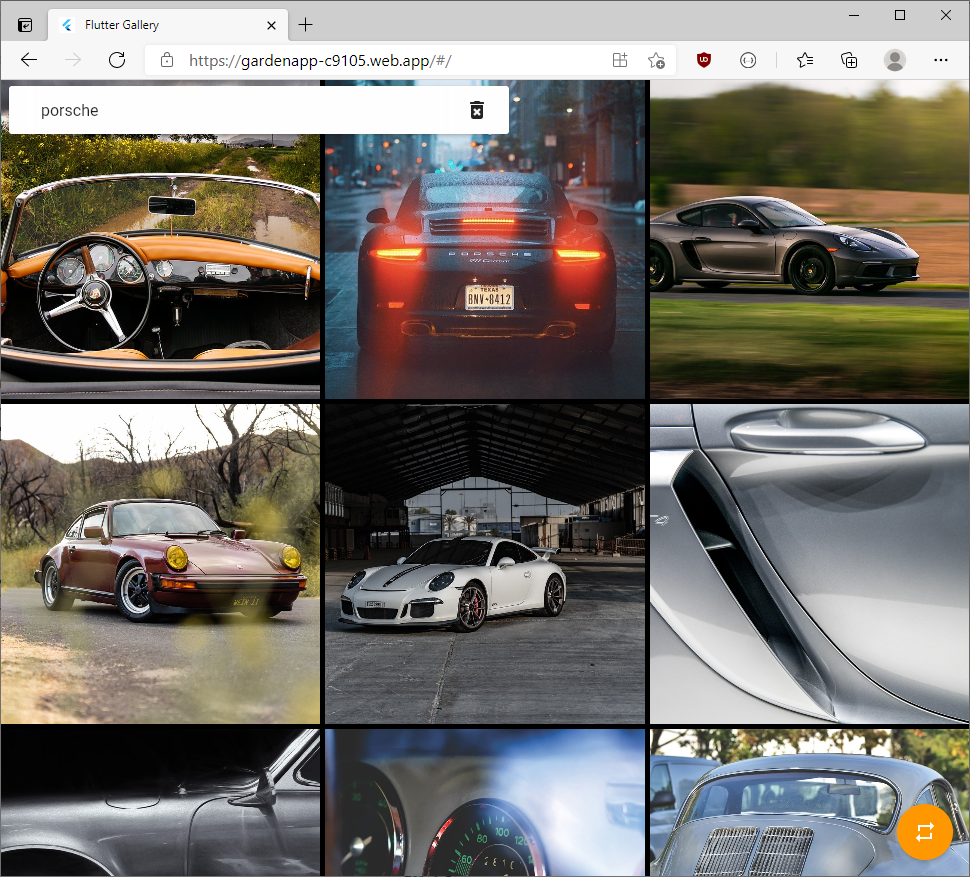
Flutter gallery (Progressive Web App) for iOS/Android/Web/Desktop
About The Project
Progressive Web App (PWA) built with Dart and the Flutter framework. The same codebase is used for running on Android, iOS, Web and even desktop apps.
The app is a gallery / wallpaper finder app, which fetches data from a remote endpoint and displays images using a grid view and a page view. Hero (shared element) transitions are used to achieve a seamless experience.
Running natively by using the Flutter apps
The app is compiled to platform specific apps (iOS or Android) and runs normally by installing the app.
Running in the mobile browser
Flutter 2.0 introduced stable web support and compiling for web is very easy, assuming all used plugins are web compatible.
The web version of the app is hosted on Firebase and works on desktop and mobile browsers.
It can be used as a regular Web App or it can installed as a standalone app by opening the URL and choosing to install the PWA.
The web app is responsive and the code decides how to scale the columns based on the available screen space.
Certain elements will only be displayed on the Web app, such as the arrows to navigate left/right.
Additionally, the web version can be navigated using the arrow keys and the ESC key for going back.
Contributions are what make the open source community such an amazing place to be learn, inspire, and create. Any contributions you make are greatly appreciated.
Fork the Project
Create your Feature Branch (git checkout -b feature/AmazingFeature)
Commit your Changes (git commit -m 'Add some AmazingFeature')
Push to the Branch (git push origin feature/AmazingFeature)
Open a Pull Request
License
Distributed under the MIT License. See LICENSE for more information.
Contact
Feel free to email if you have any questions about the concepts used or any questions about the app in general.
Se plantea realizar el diseño e implementación de un procesador de lenguajes que realiza un análisis léxico, sintáctico y semántico
del lenguaje JavaScript-PL, incluyendo la tabla de símbolos local y global. Para el desarrollo de este analizador nos apoyamos de la
herramienta JavaCC que es un generador de analizadores sintácticos descendente. El código fuente está escrito en el lenguaje de Java,
la entrada de este programa es un código fuente JavaScript(.js) y si el análisis es correcto genera 3 ficheros(tokens.txt, parser.txt
y TablaDeSimbolos.txt) en el mismo directorio del código. Si este análisis no es correcto se muestran los errores léxico y sintácticos
en la consola, y los errores semánticos en el fichero log.txt. Para comprobar que el análisis es correcto construimos el árbol sintáctico
con el parser, para esto nos apoyamos de la herramienta proporcionada por la asignatura(VASt). Para la compilación de nuestra práctica
se debe añadir lo siguiente:
• Para que funcione JavaCC se debe incluir al PATH la siguiente ruta del disco PROYECTO- PDL/javacc/bin
• Desde el cmd se ejecuta lo siguiente: java LexicoSintactico < fichero.js > log.txt, y esto genera todos los ficheros(tokens.txt,
TablaDeSimbolos.txt y parser.tx)
Vue Design System is an open source tool for building UI Design Systems with Vue.js. It provides you and your team a set of organized tools, patterns & practices that work as the foundation for your application development.
The tool is built on top of Vue.js, Vue Styleguidist, Webpack, and Theo and is aimed for designers and front-end developers who have at least basic knowledge of component based workflows + HTML, SCSS & JavaScript.
Made by @arielsalminen and other contributors. See also the official website of Vue Design System and read my article on the processes and workflow I use to get started with a new design system project.
Features
A set of interconnected patterns & practices for you and your team.
A well thought-out terminology, naming conventions, and hierarchy.
Get an automated overview of how your design system progresses over time.
Global design tokens in YAML format that you can use inside any component.
Automatic generation of living, user editable documentation.
Easily export and use your Design System as an NPM dependency in another Vue.js or Nuxt.js project.
Create a token, an element, or a pattern, and it’s immediately available across all components.
Pre-configured Prettier setup for auto-formatting code on both save and before commit.
Live Reloading, Autoprefixing, SCSS, and helper functions + simple and sane defaults for SVG and Webfont usage out-of-the-box.
Documentation and the app logic are separated, so you can have public docs while the app itself stays private.
About to get started with a new design system? I’m an independent designer and developer, specialized in helping companies to build design systems. I also conduct design system workshops and do consulting. Let’s talk!
These instructions will get you a copy of the project up and running on your local machine for development and testing purposes. See deployment for notes on how to deploy the project on a live system.
An alternative to installing MongoDB on your local machine is to use a cloud-hosted MongoDB.
(mlab.com)[https://mlab.com/] is a free-to-use Database-as-a-service.
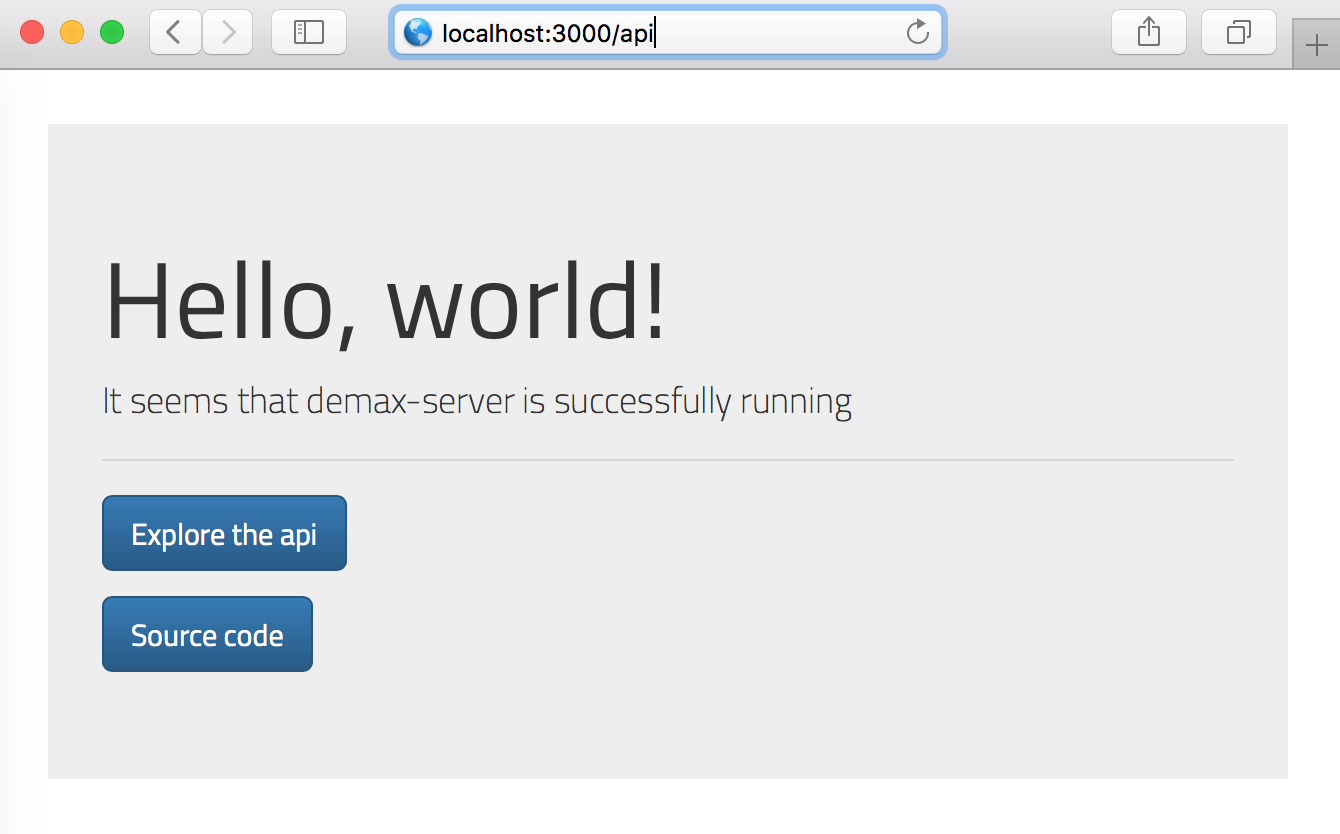
Npm run dev initiates a mongod instance and sets the server to listen at port 3000.
To check if the server works, go to http://localhost:3000/api –
it should look like in the picture below.
PM2
pm2 start process.yaml
To start the server with the process manager, make sure that PM2 is installed globally. The configuration file ‘process.yaml’ provides all the information PM2 needs to run the server.
Useful commands:
pm2 monit – Starts the PM2 app monitor
pm2 logs – Display the logs
pm2 stop 0 – Stop the process (If you haven’t used PM2 before, ‘0’ is probably the process ID for demax-server)
pm2 delete 0 – Deletes the process instance
This command starts the mocha test runner with variables for local testing. The test files are located in the folder test/ and all end with “.spec.js.”.
Deployment
This server is configured to be deployed with Docker – there are several different docker-compose files in this repository for different environments.
In the default settings, demax-server is configured to listen to port 3000. The information contained in the file docker-compose.yaml (in the root directory) has all the required information needed to pull the newest image from Dockerhub
Contributing
Please read CONTRIBUTING.md for details on our code of conduct, and the process for submitting pull requests to us.
Authors
Jeremias Hillerberg
License
This project is licensed under the BSD-2 License – see the LICENSE.md file for details
These instructions will get you a copy of the project up and running on your local machine for development and testing purposes. See deployment for notes on how to deploy the project on a live system.
An alternative to installing MongoDB on your local machine is to use a cloud-hosted MongoDB.
(mlab.com)[https://mlab.com/] is a free-to-use Database-as-a-service.
Npm run dev initiates a mongod instance and sets the server to listen at port 3000.
To check if the server works, go to http://localhost:3000/api –
it should look like in the picture below.
PM2
pm2 start process.yaml
To start the server with the process manager, make sure that PM2 is installed globally. The configuration file ‘process.yaml’ provides all the information PM2 needs to run the server.
Useful commands:
pm2 monit – Starts the PM2 app monitor
pm2 logs – Display the logs
pm2 stop 0 – Stop the process (If you haven’t used PM2 before, ‘0’ is probably the process ID for demax-server)
pm2 delete 0 – Deletes the process instance
This command starts the mocha test runner with variables for local testing. The test files are located in the folder test/ and all end with “.spec.js.”.
Deployment
This server is configured to be deployed with Docker – there are several different docker-compose files in this repository for different environments.
In the default settings, demax-server is configured to listen to port 3000. The information contained in the file docker-compose.yaml (in the root directory) has all the required information needed to pull the newest image from Dockerhub
Contributing
Please read CONTRIBUTING.md for details on our code of conduct, and the process for submitting pull requests to us.
Authors
Jeremias Hillerberg
License
This project is licensed under the BSD-2 License – see the LICENSE.md file for details
For casdoor, if you have any questions, you can give Issues, or you can also directly start Pull Requests(but we recommend giving issues first to communicate with the community).
I18n translation
If you are contributing to casdoor, please note that we use Crowdin as translating platform and i18next as translating tool. When you add some words using i18next in the web/ directory, please remember to add what you have added to the web/src/locales/en/data.json file.
Firefly is an open-source web-based UI library for astronomical data archive access and visualization developed at Caltech.
The development was started in the context of archive-specific applications at the NASA/IPAC Infrared Science Archive (IRSA), and was then generalized to serve data from many different archives at IRSA (and beyond). It was open sourced in 2015, hosted at GitHub.
Firefly is designed to build complex web-based front-end applications making use of reusable React components to enable accessing and exploring astronomical data with advanced data visualization capabilities.
The visualization provides user with an integrated experience with brushing and linking capabilities among images, catalogs, and plots. Firefly is used in IRSA GUIs to query and visualize data from missions such as WISE, Spitzer, SOFIA, ZTF, PTF, etc. and a large number of highly-used contributed data products from a diverse set of astrophysics projects. It is also used in various user interfaces of the NASA Exoplanet Science Institute (NExScI) and the NASA/IPAC Extragalactic Database (NED), as well as to construct the Portal Aspect of the Vera C. Rubin Observatory Science Platform.
Quick-start
The fastest way to start using Firefly and check examples is to make use of Docker images.
See the Docker quick-start here.
Firefly is being reused for various archives because it is a framework of archive components. This has allowed us to implement multiple archive systems at a fraction of the cost of the first system, Spitzer Heritage Archive. Firefly has undergone an extensive re-write since then, adopted React/Redux framework for the client side, making it much easier to work with other JavaScript libraries. Firefly’s general scientific visualizations are based on the Plotly.js graphing library.
Firefly Viewer
By default, this repository builds a default example webapp. This tool can be used for viewing FITS data, catalogs, and xyplots. It is a general viewer tool for retrieving and viewing astronomy related data.
Firefly APIs
Firefly APIs exposes the most powerful components of Firefly in a way that can be used by any web page with no prerequisites. It allows any web developer access to Firefly’s FITS visualizers or Table Tool with just a very few lines of JavaScript. The goal is to make these APIs very easy to use with only a 10 minute learning curve.
An important feature is that the Firefly APIs server can be installed cross-site. In other words, it is not required to be on the same server as the web page. Firefly APIs can do this because it uses JSONP or CORS for the server communication. This allows Firefly APIs not to be limited by the server’s Same Origin Policy and to give the developer a lot of flexibility. The web developer does not have to do any installation, but can simply just start using Firefly APIs.
Visualizers
The firefly components contain three main visualizers for astronomy data.
Tabular Data Display
Firefly has implemented “Excel-like” tables on the webpage. In an easy, interactive way, a user can sort the results, filter the data on multiple constraints, hide or show columns, or select data for download or visualization. The Firefly APIs server is optimized to show very large tables without significant performance degradation. We have tested it with over 10 million rows, 50 column tables.
FITS and HiPS Visualization
Firefly provides a first-class FITS visualization on the Web without any plugins. All of the significant components you would expect to see in a basic desktop FITS application are available with data that Firefly displays. The FITS visualizer allows for overplotting any table data with Lon(RA) and Lat(Dec). Therefore, users can overlay multiple catalogs over their FITS image and interact with it.
In addition, Firefly is able to display all-sky images in the IVOA standard HiPS format, and display catalogs overlaid on them just as with FITS images.
Scientific Plotting
Firefly shows 2D graphs interactively so that a user can read the data point values as moves mouse around or zooms in to investigate the data at a finer level. These graphs are used for plotting table columns. The user can specify any column that the tables are showing. The user can also define expressions from the columns for the XY Plot, such as (col1*col2/tan(col3)). Table based charts share their data model with the table, so both table and chart can trigger or respond to the common events, such as filtering of the data. Firefly also supports creating and plotting 1D histograms and heatmaps (2D histograms).
Branches and tags
There are several branches in the repository. Here are the ones that you should care about.
rc-YYYY.N: The next release candidate branch. This is generally the most stable branch.
dev: This branch could be updated every day. It is the active development branch. It is not stable. Nightly builds are performed.
firefly-xxx-reason, IRSA-xxx: These branches are temporary development feature branches and are associated with corresponding tickets in IPAC Jira.
Tags: Firefly is tagged for releases and pre-releases
[Tomcat 9] (https://tomcat.apache.org/download-90.cgi)
Apache Tomcat is an open source software implementation of the Java Servlet and JavaServer Pages technologies.
[Node v18] (https://nodejs.org/)
Javascript interpreter for command line environment, used for development tools
Prepare before the build
Make sure you have <GRADLE>/bin, <JAVA>/bin, and <NODE>/bin in your PATH.
Install yarn via npm: npm install yarn -g
How to build Firefly.jar:
First git clone the firefly repository or download the zip (and unzip) to your target machine. Then install the prerequisites (node, java, tomcat).
In a terminal, cd into the firefly directory, then run:
$ gradle :firefly:jar
This generates firefly.jar located at ./jars/build/.
You may include this jar into your project to build advanced astronomy web applications.
How to build and deploy Firefly Viewer:
In a terminal, cd into the firefly directory, then run:
$ gradle :firefly:war
To include the API documentation and tutorial into the war archive run:
$ gradle :firefly:warAll
This generates firefly.war located at ./build/dist/.
Simply drop this file into your $CATALINA_HOME/webapps/ directory to deploy it.
$CATALINA_HOME is your Tomcat server installation directory.